Applications
Chip-Crack Analysis
Discover our exemplary applications
-
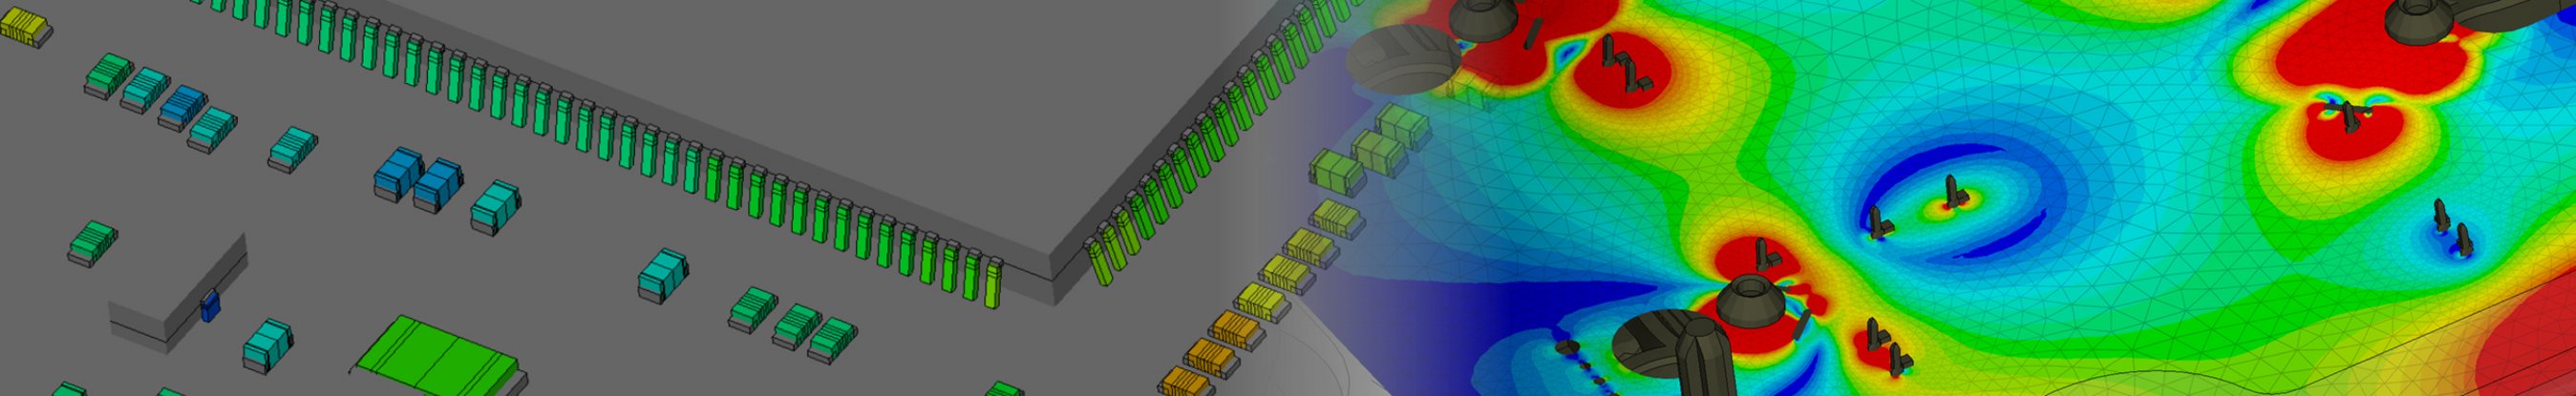
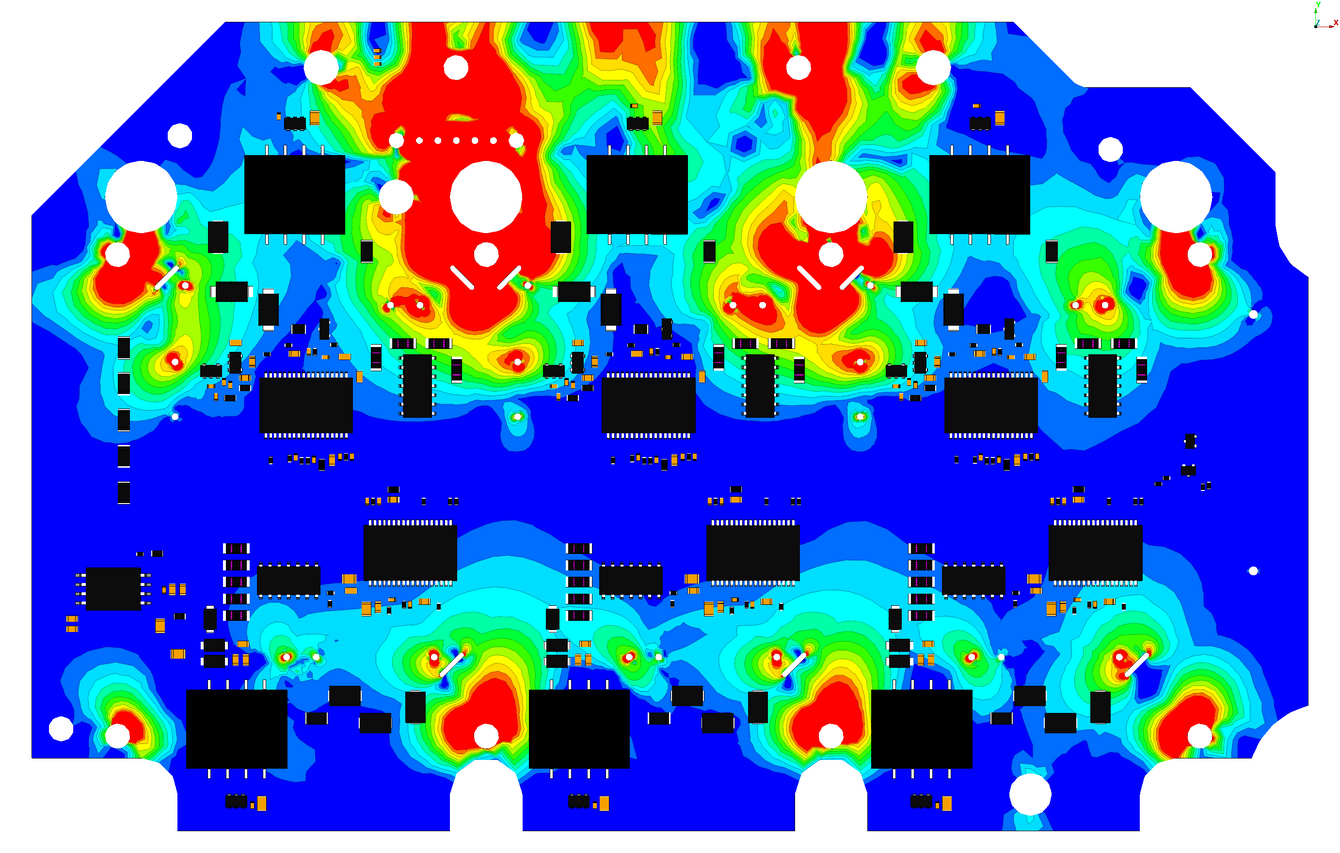
For every element of the PCB the max. occurring strain is calculated and plotted in one contour plot
-
The resulting contour plot therefore shows the worst possible strain that can occur
-
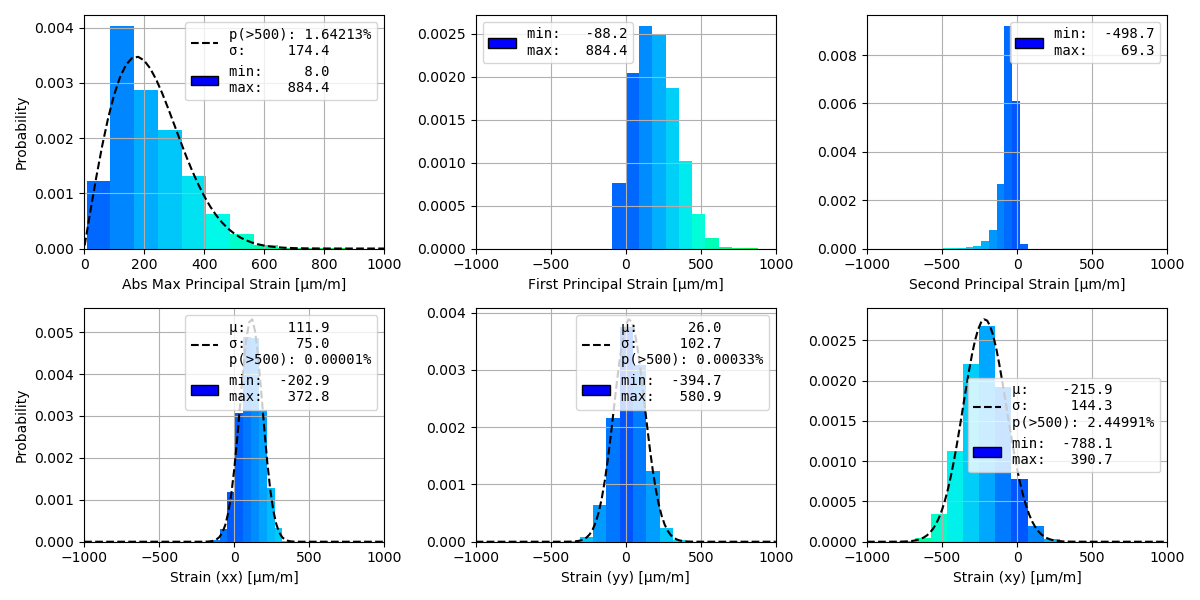
Probability of exceedance – limits are defined (e.g. 50%, 32%, 10%, 5%, 1%, 0%)
-
The maximum value of simulated PCB-strains can be determined for various probabilities of exceedance (50%, 32%, 10%, 5%, 1%, 0%)
Solder-Joint Analysis
Discover our exemplary applications
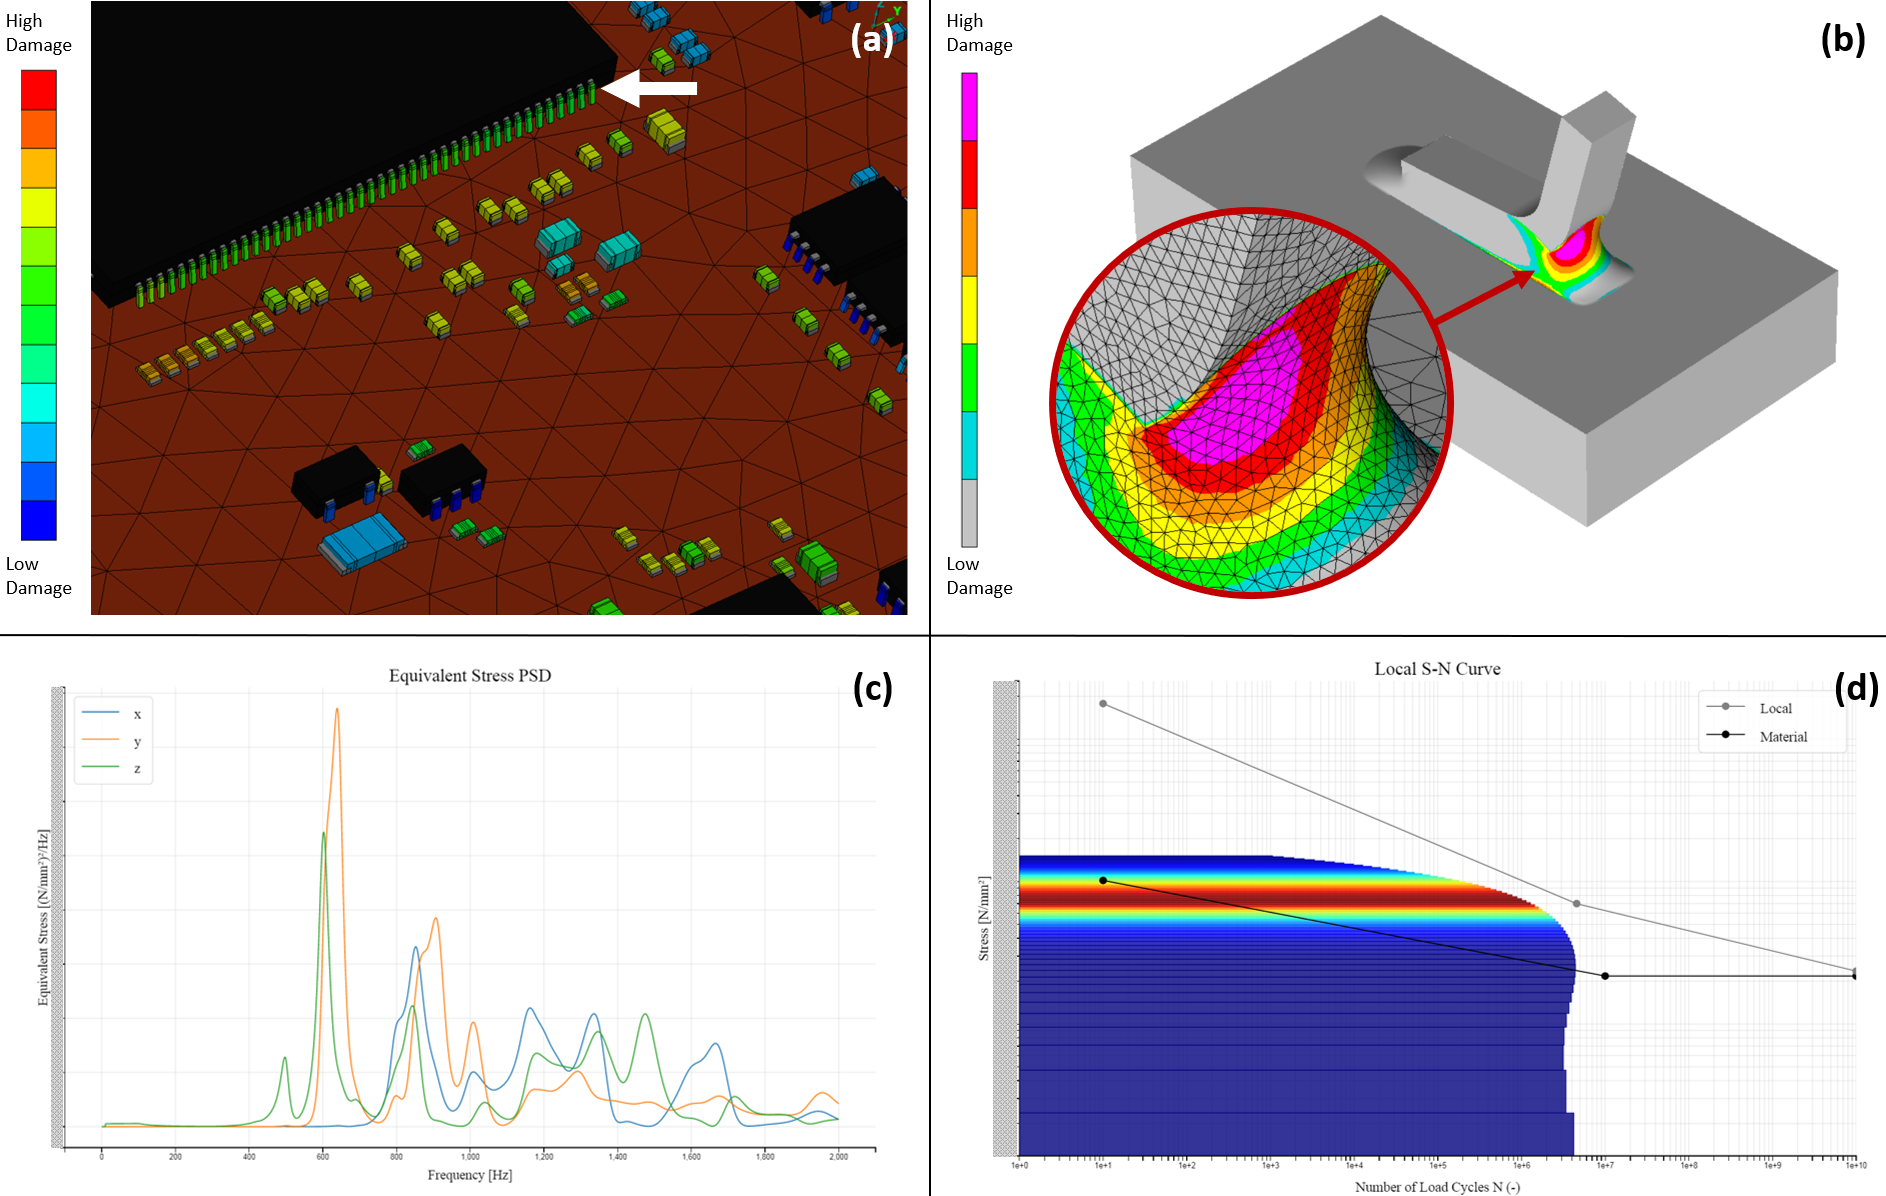
Mapped damage values of all pins of the substitute FE-models (a). Damage values for a specific sub-model (marked by the white arrow in (a) in FEMFAT visualizer (b). Equivalent stress PSDs in the most damaged node of the sub-model (b) for all acceleration directions (c). Local S-N curve for the most damaged node of the sub-model (d).
Thermo-Mechanical Analysis
Discover our exemplary applications
Shows a contour plot of the temperature distribution in a small part of the circuit board with many resistors (discharge area) during a discharge process.
Shows a temperature distribution contour plot of a detailed view of an SMD in a small part of the board with many resistors (discharge area) during a discharge process from the ISO view.
Shows a contour plot of the temperature distribution in a small part of the circuit board with many resistors (discharge area) during a discharge process from the side. The heat dissipation from the top (SMDs) to the bottom (thermal pad) can be seen.
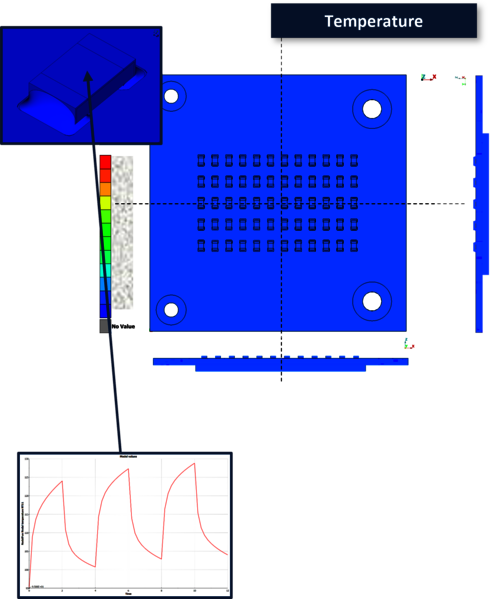
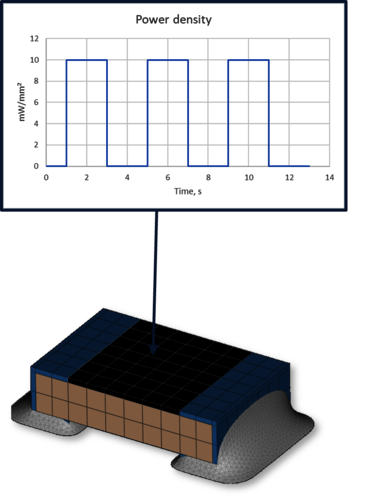
Load-definition
The definitions of transient loads are possible. In this case three power-dissipation cycles were applied on the upper side of a resistor array.
The resulting power dissipation leads to an inhomogeneous heat up of the PCB. The Copper has a higher thermal conductivity than the FR4 and resin.
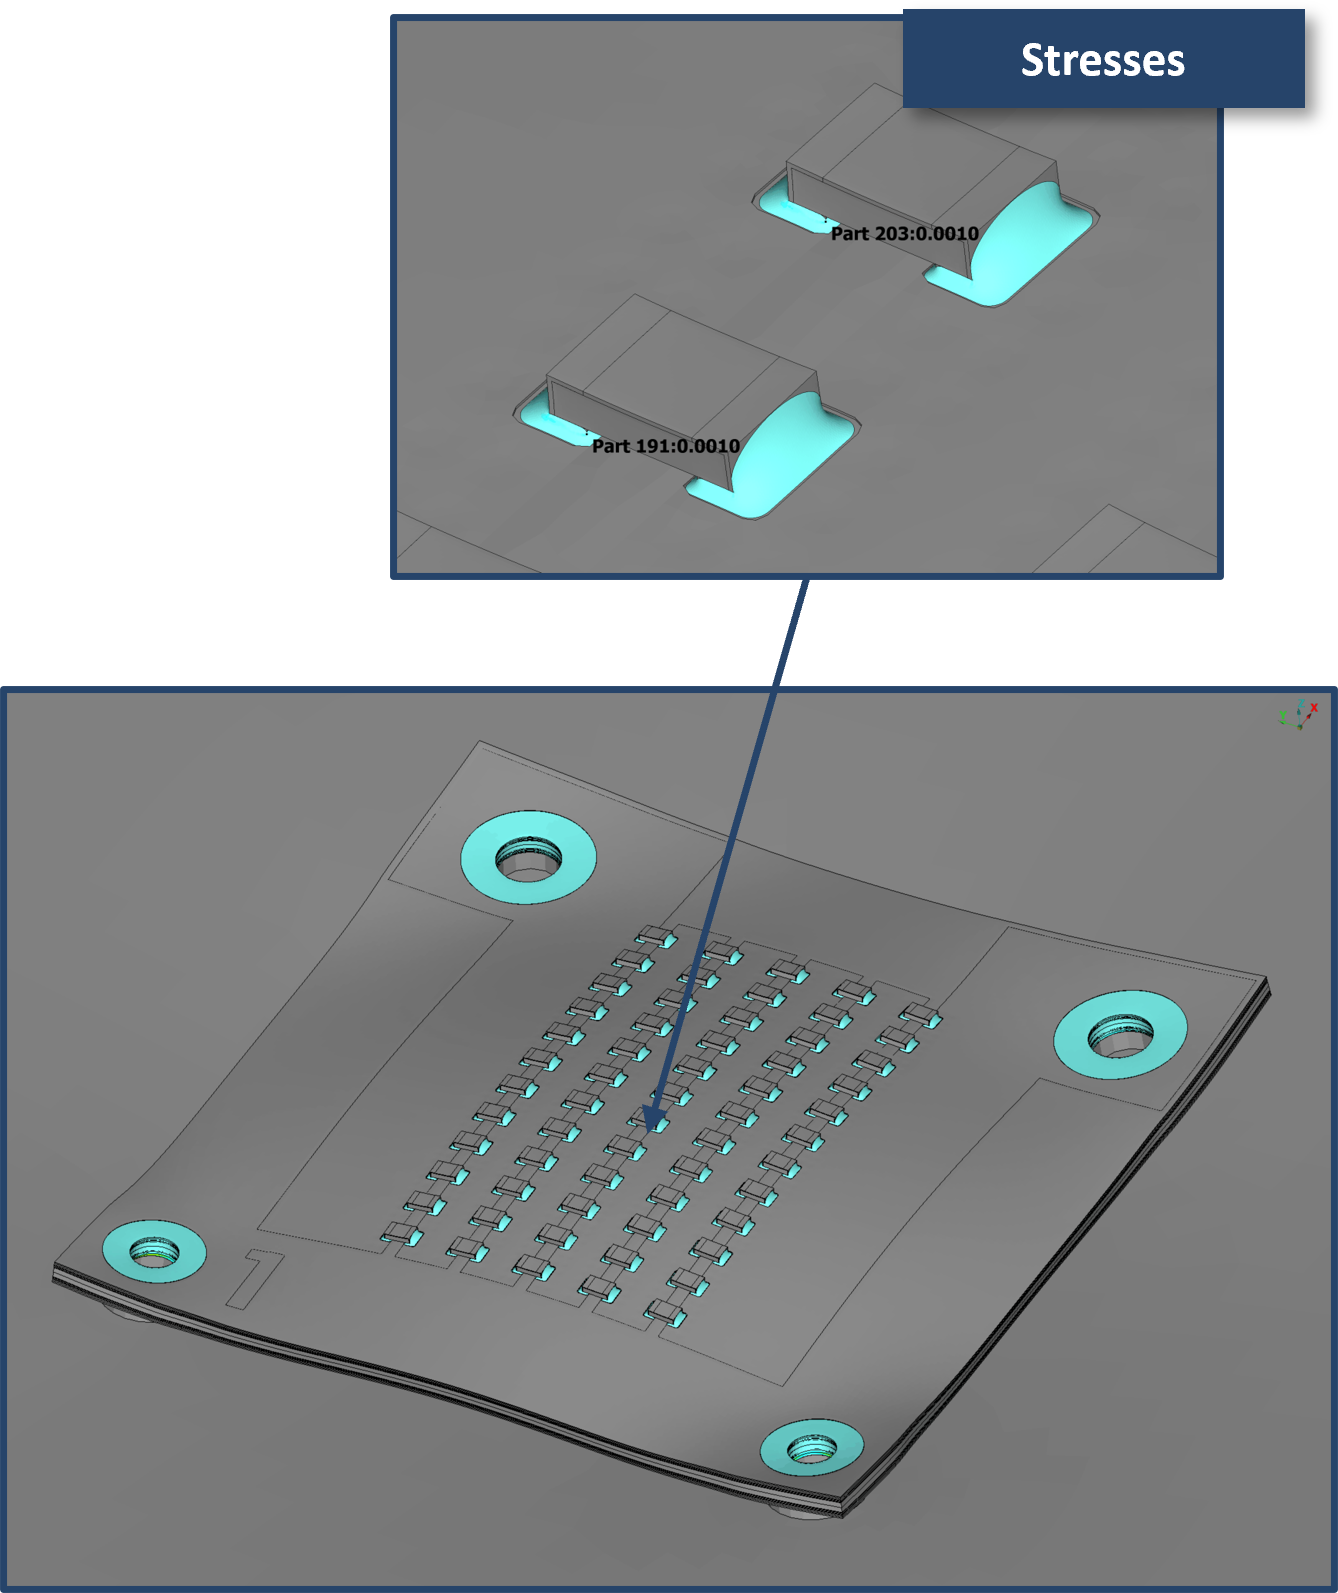
The inhomogeneous heat up of the PCB can lead to high strains and stresses in different regions of the PCBA. In this example the solder joints of the SMDs experience elasto-plastic stresses.
Interested in more?
Modelling Approach
Modules